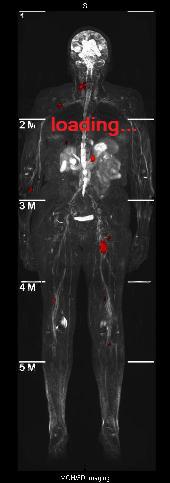
Interactive Figure from Plotkin et. al. (PLoS ONE, 2012)

|
||
| Total tumor volumes were combined and scaled for each patient. Regions with higher tumor burden are shown in yellow. Clustering of our data set revealed distinct groups of patients based on predominant tumor location. The partitioning of patients was significantly associated with age (p=0.06, Kruskal-Wallis). |